

Beyond Debt - to - GDP: A French Perspective on National Debt and the Bigger Picture
- Aug 7, 2025
- 12 min read
Introduction
These days, it feels like we are talking about just one number when it comes to public finances: the debt-to-GDP ratio. Whether it is Friedrich Merz’s fiscal consolidation plan in Germany, Donald Trump’s so-called “Big Beautiful Bill” in the United States, or François Bayrou’s latest budget proposal in France, the same percentage keeps coming back as if it were the ultimate measure of a country’s economic health.
As a French student, I grew up hearing this ratio everywhere, repeated in every news bulletin like a national mantra: “La dette publique atteint 100% du PIB.” For years, it shaped my perception of what “good” or “bad” fiscal policy meant. A higher number sounded alarming; a lower number reassuring. And yet, as I’ve learned more about economics and looked at how different countries manage their debt, I have begun to wonder: are we not giving too much power to a single, simplistic indicator?
The debt-to-GDP ratio certainly has its merits. It is simple, comparable across countries, and politically convenient. But can it really tell us whether a nation’s debt is sustainable, or whether its borrowing is helping or hurting its future? Looking at France, the United States, Japan, or Switzerland, the answer seems more complex than what this single ratio suggests.
What Is Debt-to-GDP and Why Does It Dominate Discourse?
The debt-to-GDP ratio is straightforward on the surface: it is total government debt divided by the country’s annual GDP, expressed as a percentage. This indicator allows easy comparison of debt burdens across economies of different sizes. A debt of €2 trillion might sound enormous in isolation, but if that country’s GDP is €4 trillion, the debt-to-GDP ratio is 50%; if GDP is only €2 trillion, the ratio is 100%. In essence, the ratio contextualizes debt relative to the capacity of the economy to sustain it. Governments and international bodies have long used this metric as a shorthand for fiscal health. The European Union’s 60% debt-to-GDP threshold was intended to ensure governments don’t accumulate “excessive debt burdens”. Similarly, in media and public debates, the number often serves as a quick indicator of whether a country is living beyond its means. A rising ratio can ring alarm bells about unsustainable borrowing, while a low ratio signals prudence. The intuitive appeal is clear: if debt equals 100% of GDP, it’s as if the country owes an entire year’s worth of its economy, a situation easy for anyone to grasp.
However, the debt-to-GDP ratio’s prominence also comes from it being simple. It’s a single number that fits neatly into headlines and debates. Complex concepts like debt maturity profiles, interest rate dynamics, or the composition of creditors don’t lend themselves to sound bites as easily. Politicians can invoke the debt ratio to argue for spending cuts or fiscal reforms and instantly sound responsible. Likewise, critics can use it to accuse governments of mismanagement. Over time, this ratio has virtually become a household term in France, aught in school, economics classes, cited in election campaigns, and splashed across news graphics whenever the national budget is discussed.
Yet, as I’ll discuss, there is a danger in fixating on this single metric without context. First, though, let’s see how France stacks up against other countries and why a high or low ratio isn’t inherently “good” or “bad” without understanding the bigger picture.
A Tale of Four Countries: France, the US, Japan, and Switzerland
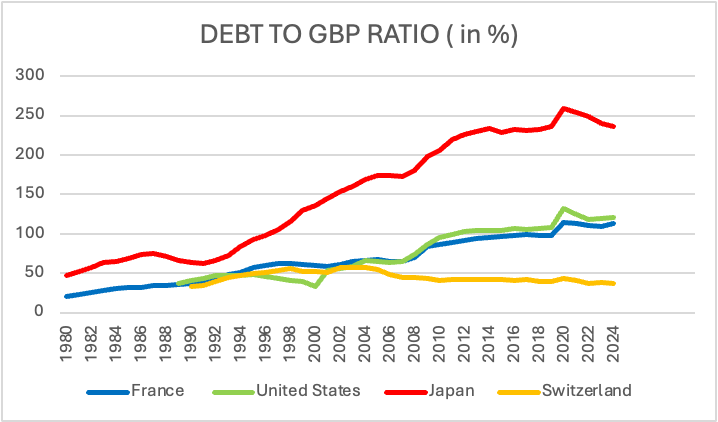
To illustrate the nuances behind the debt-to-GDP ratio, let’s compare four developed countries often cited in discussions about public debt: France, the United States, Japan, and Switzerland. These nations span a spectrum from relatively high debt (France and the U.S.) to extremely high debt (Japan) to very low debt (Switzerland). On the surface, their debt ratios might suggest who is fiscally reckless and who is prudent but the reality is more complex.
France’s debt stands around 110% of GDP, well above the EU’s 60% Maastricht threshold. The United States is in a similar range, at about 120%, but benefits from issuing debt in the world’s reserve currency. Japan is the outlier: with a staggering 250% debt-to-GDP, it should, by conventional standards, be in crisis but yet it isn’t, largely because most of its debt is held domestically and financed at very low interest rates. Switzerland, by contrast, sits at the other end of the spectrum, with debt below 40% of GDP, thanks to strict fiscal rules and a political culture favoring balanced budgets. As we see, the same debt-to-GDP ratio can mean very different things in different contexts. France and the U.S. have similar ratios but face different pressures. Japan’s astronomical ratio hasn’t caused the kind of crisis one might expect, due to mitigating factors. Switzerland’s low ratio reflects deliberate policy choices supported by its citizens, trading off some spending for long-term prudence.
Beyond the Ratio: Why the Debt Picture Is Bigger than One Number
Despite its ubiquity, the debt-to-GDP ratio has serious limitations as a stand-alone measure of a nation’s financial position. An elementary issue is that it mixes a “stock” with a “flow.” Debt is a stock (the accumulation of all past borrowing at a given moment), while GDP is a flow (the value of output produced in one year). When we say “debt is 110% of GDP,” we’re essentially comparing a stock measured in currency (euros, dollars, etc.) to an annual flow measured in currency per year. As economist Paul Sheard points out (Sheard, 2020), this means the ratio’s units are in years (it roughly indicates how many years of current GDP would be needed to pay off the debt). Framing it that way actually makes it less scary: a debt-to-GDP of 100% means debt equals one year’s GDP. For an immortal entity like a government (which, unlike a person or company, can in theory roll over debt indefinitely), owing the equivalent of one year’s income is not automatically catastrophic. In fact, Sheard argues that quoting debt as a percentage of GDP “violates a basic rule” of using consistent units and can mislead policymakers. After all, governments do not pay off all their debt in one year or even need to. As long as they can service the interest and refinance maturities, the debt can be sustained or even rolled forever. This is fundamentally different from a household or business, which eventually needs to retire its debt. Governments, especially those that borrow in their own sovereign currency, can and typically do refinance endlessly. “Unlike an individual or company, the government does not really ever have to repay its debt,” Sheard notes bluntly. It can be rolled over continually, and if the debt is in the country’s own currency, the central bank can always create money to buy the debt in a pinch (as we saw with quantitative easing programs).
Another major limitation of the debt/GDP ratio is that it tells us nothing about the interest burden or affordability of that debt. A country with debt at 100% of GDP that pays 1% interest on its debt has a much lighter burden than a country with debt at 50% of GDP paying 10% interest. Consider Japan versus Italy, for example: Japan’s debt is over 200% of GDP, Italy’s around 140% but Japan’s government for years paid close to 0% interest on much of its debt, whereas Italy historically paid much higher rates, reflecting market perceptions of risk. What matters for sustainability is the debt service (interest payments) relative to government revenue or GDP, and the growth rate of the economy relative to interest rates. For instance, the United States in recent years saw its debt ratio climb, but because interest rates were so low, the share of GDP going to interest actually fell below 2% in the 2010s. Now with rising rates, interest outlays are nearing 3% of GDP. Japan, despite its huge debt, had interest costs around or below 1% of GDP for a long time thanks to near-zero rates. If we only look at the debt ratio, we miss this nuance. A high debt can be very affordable if interest is low and a lot of the debt is long-term or held by friendly creditors. Conversely, even a moderate debt can become burdensome if interest rates spike or creditors lose confidence. Thus, context like interest rates, debt maturity, and who holds the debt are crucial.
Relatedly, the debt-to-GDP figure doesn’t distinguish gross debt from net debt. Gross debt counts everything the government owes, but governments also hold assets (foreign exchange reserves, investments, even companies or land). Some countries have sovereign wealth funds or large pension reserves. Japan, as noted, has massive assets (including foreign assets); when you subtract those, its net debt is roughly half the gross level. Another example: a few years ago, Greece’s gross debt was around 180% of GDP, but much of that was owed to official European lenders at low interest, and Greece’s government also had significant financial assets from various sources so in the end net debt was lower. In contrast, a country might have lower gross debt but also few assets, making its net position not much better. For a fuller picture, one should ask: What is the government’s net financial position? The media rarely talks about that, likely because net debt data is trickier to get and less understood by the public. But it matters. It’s akin to evaluating a person’s debt without considering if they have savings or investments. A person with a $300,000 mortgage and $100,000 in stocks is not in the same position as someone with the same mortgage and no savings!
If a country borrows in a currency it fully controls (like the U.S. borrowing in dollars or Japan in yen), it has more tools to avoid default, for example by printing more money, although this carries the risk of inflation. Countries that lack their own currency flexibility are more constrained. This is the case for Eurozone members like France: France cannot unilaterally print euros; it gave up the franc for the euro, and the European Central Bank is shared. That means France’s debt, even though in euro, is somewhat like foreign-currency debt, as the French government can’t monetary-finance it on its own. This distinction helps explain why markets worry more about Italy or France at 110% debt/GDP than, say, the UK at 100% (the UK has the Bank of England to backstop its debt if needed). Japan and the U.S. are firmly in the “own currency” camp, which grants them leeway that emerging markets or eurozone countries don’t have. When people cite Japan’s 250% ratio without context, they often overlook that issuing debt in yen to mostly Japanese creditors is a world apart from, say, an Argentina issuing in dollars to foreign investors, which can lead to crises at much lower debt ratios.
Who holds the debt is also crucial, as touched on earlier. Japan’s debt is largely home-grown, which creates stability (domestic banks aren’t likely to suddenly dump Japanese bonds en masse; also interest paid ends up back in Japanese hands). In contrast, a significant chunk of U.S. and French debt is held abroad (China holds U.S. Treasuries; European and American investors hold French bonds, etc.). Foreign holders might be more fickle if they fear inflation or default, demanding higher yields or selling off, which can pressure a government in ways that a captive domestic investor base does not. Again, the headline debt ratio doesn’t tell you this composition. It’s another reason Japan has endured high debt, as overseas creditors are minimal, so Japan faces little pressure to “please” foreign bond markets. Meanwhile, countries like France and the U.S., despite respectable ratings, ultimately rely on the confidence of global investors for a share of their debt.
Lastly, the debt-to-GDP ratio doesn’t reflect what the debt was used for. This is a more qualitative point, but an important one. Borrowing 10% of GDP to invest in education, infrastructure, or technology might raise future GDP by more than 10%, making the debt worthwhile. Borrowing the same amount to fund, say, unsustainable pension promises or tax cuts for short-term stimulus might not yield a future economic return. Two countries with the same debt ratio could have very different debt legacies, with one having world-class highways, universities, and a stronger economy to show for it; the other might have little to show because the money was spent less productively. Unfortunately, the ratio offers no insight into this quality of debt. It’s analogous to two businesses with equal debt-to-revenue ratios, where one invested its debt in profitable new projects and the other just covered operating losses, making it clear that one is in better shape than the other, even though the ratio alone wouldn’t reveal it.
Given all these factors, including interest rates, debt composition, net versus gross figures, currency, and use of funds, it is clear that focusing obsessively on the debt-to-GDP ratio in media and politics can oversimplify complex realities. The ratio is certainly relevant: it gives a rough scale of debt relative to the economy. But it’s not a definitive verdict on a country’s solvency or economic wisdom. High debt is not always a crisis, as Japan shows, and low debt is not always an optimal policy. Perhaps the Swiss could have slightly higher debt if it meant better infrastructure or other investments; that is a political choice. Moreover, an excessive fear of the debt ratio can sometimes backfire. For instance, in the eurozone debt crisis of the early 2010s, several countries underwent harsh austerity measures largely to improve their debt metrics; this sometimes shrank their GDP (the denominator) so much that debt/GDP didn’t even improve as intended, all while causing social pain. In other words, if you treat the ratio as the only target, you might end up hurting the economy, which then makes the ratio worse. A broader and more nuanced approach is needed.
Conclusion: Understanding the Bigger Picture and Trusting the Public With It
Having grown up inundated by talk of “debt-to-GDP,” I understand why this ratio holds such sway. It offers a simple, seemingly concrete way to compare today’s debt with the past or with other countries. It grabs attention; “200% debt-to-GDP” sounds dire, and perhaps that is useful to spur public discussion or encourage government discipline. But after researching and reflecting on this topic, I have become convinced that we do a disservice by using the debt-to-GDP ratio as a one-dimensional score of a nation’s fiscal health. The bigger picture matters, and I firmly believe the public can understand that bigger picture if we explain it properly, rather than just tossing out one ratio and igniting panic or complacency.
Media outlets and policymakers often underestimate the audience’s ability to grasp nuance. Yes, concepts like bond yields, debt maturities, or net debt are more complex than a single percentage. But they are not beyond comprehension. For instance, explaining that France’s 114 percent debt-to-GDP ratio is not the whole story is important. One should also consider France’s interest payments, which remain low as a share of GDP, its long average debt maturity of around eight years, and the fact that it cannot devalue its currency like Japan or the United States. These points can be conveyed in plain language. Likewise, journalists could contextualize a country’s debt by saying, for example: “Japan’s debt is 250% of GDP, but most of it is owed to itself and the government also has large assets, so its situation is different from a country that owes mostly foreign creditors”. This kind of explanation brings more light and less heat to the discussion.
Using only the debt-to-GDP ratio in media can also skew public perception and policy. It creates a “debt bad, lower debt good” narrative that might not always hold. For instance, during a recession or a pandemic, strict adherence to reducing the debt ratio could lead to premature austerity, worsening the economy (shrinking GDP) and ironically making the debt ratio higher. Conversely, investing borrowed funds wisely can stimulate growth and make the debt more sustainable, a point that is lost if one focuses solely on the size of the debt. The population is capable of understanding that debt is a tool, it can build or it can break, depending on how it’s used. Most people manage personal debt like mortgages or student loans by considering interest rates and future earnings, not just the size of the loan relative to their salary at one moment. We should evaluate national debt in a similar multi-faceted way.
In my opinion, we need to change how we talk about public debt. The debt-to-GDP ratio should be presented as one indicator among several, not as a standalone verdict. Politicians and pundits might find it convenient to rally around a single number because it simplifies messaging, but this often reduces complex economics to a misleading morality tale. I am not arguing that debt levels don’t matter, because they clearly do. But we shouldn’t fetishize the 60% or 100% thresholds without context. A high ratio can signal caution, absolutely; it can mean heavier future burdens or reduced fiscal space. But it doesn’t automatically spell doom, just as a low ratio doesn’t guarantee prosperity.
As a French citizen reflecting on my country’s discourse, I understand why many are worried when they hear “114% of GDP in debt.” There is a valid concern that future generations will have to deal with this liability. However, I’d argue that the best way to prepare for the future is to have an informed public debate beyond the slogans. Let’s discuss how much of that debt is held domestically versus abroad. Let’s talk about what interest rate changes could mean, or how structural reforms might boost growth and ease debt pressures. And importantly, we should consider what the borrowing has achieved. And importantly, we should consider what the borrowing has achieved. Are we leaving behind valuable assets and a stronger economy, or simply a burden of future repayments without lasting benefits?
In conclusion, the debt-to-GDP ratio is a useful starting point, but it should not be the ending point of analysis. I am against using only this ratio as the sole barometer in all media coverage because it can mislead and oversimplify. Instead, I advocate for presenting the bigger picture, one that includes debt and assets, interest costs, growth, and the qualitative impact of what debt funds. By trusting that the public (students, professionals, and yes, voters) can understand these concepts when communicated clearly, we elevate the conversation from a narrow obsession with one number to a more nuanced understanding of fiscal health. Ultimately, a well-informed populace will be better equipped to support sound financial policies than a populace simply alarmed by a ratio they’ve been told to fear. As someone who has followed this issue for years, I remain hopeful that we can move the discourse beyond debt-to-GDP alone, Towards a richer dialogue about our economic future, one that acknowledges the importance of the ratio while also recognizing its limits within the broader context of public finance.
References
Allen, M. (2023). Explainer: Swiss spending meets the debt brake. SWI swissinfo.ch. https://www.swissinfo.ch/eng/explainer--swiss-spending-meets-the-debt-brake/49044890
Bergstresser, D. (2024). The rising burden of U.S. government debt. Econofact. https://econofact.org/the-rising-burden-of-u-s-government-debt
Chancellor, E. (2024). Japan has ways to avoid a sovereign debt crunch. Reuters.
International Monetary Fund. (2024). World Economic Outlook Database: General government gross debt (% of GDP). International Monetary Fund. https://www.imf.org/en/Publications/WEO
Sheard, P. (2020). Beware the government debt-to-GDP ratio. NDTV (via Bloomberg Opinion). https://www.ndtvprofit.com/business/beware-the-government-debt-to-gdp-ratio-2282321
Strupczewski, J. (2024). France’s debt woes unnerve EU partners and markets. Reuters. https://www.reuters.com/world/europe/frances-debt-woes-unnerves-eu-2024-09-24
Wikipedia contributors. (2025). List of countries by government debt. Wikipedia.
-
Written by Hippolyte Metzger-Otthoffer


Comments